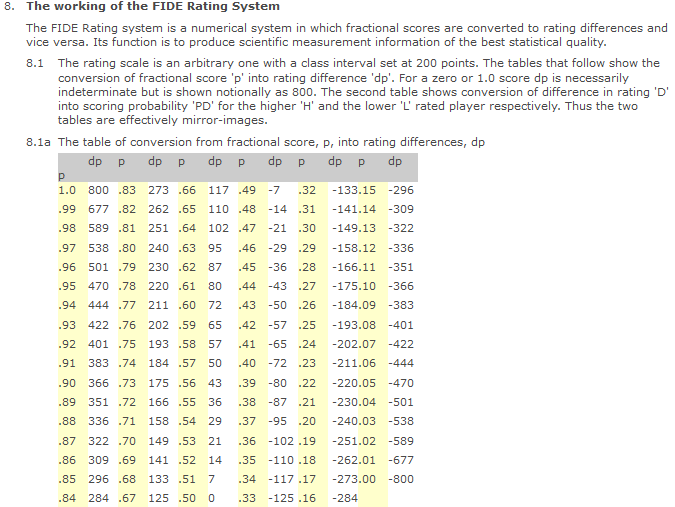
Table 8.1a is a mirror image of:
The Percentage Expectancy Table (A.E. Elo The Rating of Chess Players, 2.11)
   D        P    |    D       P    |    D        P
Rtg.Dif   H   L  | Rtg Dif  H   L  | Rtg Dif   H   L
  0-3    .50 .50 | 122-129 .67 .33 | 279-290  .84 .16
  4-10   .51 .49 | 130-137 .68 .32 | 291-302  .85 .15
 11-17   .52 .48 | 138-145 .69 .31 | 303-315  .86 .14
 18-25   .53 .47 | 146-153 .70 .30 | 316-328  .87 .13

 26-32   .54 .46 | 154-162 .71 .29 | 329-344  .88 .12
 33-39   .55 .45 | 163-170 .72 .28 | 345-357  .89 .11
 40-46   .56 .44 | 171-179 .73 .27 | 358-374  .90 .10
 47-53   .57 .43 | 180-188 .74 .26 | 375-391  .91 .09

 54-61   .58 .42 | 189-197 .75 .25 | 392-411  .92 .08
 62-68   .59 .41 | 198-206 .76 .24 | 412-432  .93 .07
 69-76   .60 .40 | 207-215 .77 .23 | 433-456  .94 .06
 77-83   .61 .39 | 216-225 .78 .22 | 457-484  .95 .05

 84-91   .62 .38 | 226-235 .79 .21 | 485-517  .96 .04
 92-98   .63 .37 | 236-245 .80 .20 | 518-559  .97 .03
 99-106  .64 .36 | 246-256 .81 .19 | 560-619  .98 .02
 107-113 .65 .35 | 257-267 .82 .18 | 620-735  .99 .01
 114-121 .66 .34 | 268-278 .83 .17 | over735 1.00 .00
How to reproduce this table?
Since the normal curve flattens, one would expect that the number of rating differences does not decrease.
However, there is a discontinuity at D = 345-357, P = 89%. This suggests that the table may contain irregularities
Rtg Dif Range
279 290 11
291 302 11
303 315 12
316 328 12
329 344 15
345 357 12 <---
358 374 16
375 391 16
392 411 19
Construction of the table is most likely:
- Let sigma = 200 * (10 / 7), where 10 / 7 is an approximation for sqrt(2). Reference: A.E. Elo, Theory of Rating Systems, privately printed monograph, 1966.
- Convert 0, 20, 40, 60, etc. into Z scores: 0, 0.07, 0.14, 0.21, etc. using Z = D / sigma.
The corresponding probabilities can be found in the "Standard normal table", which gives 0.5000, 0.5040, 0.5080, 0.5120. Elo could have used table X, p.91 from Garrett, H.E. Statistics in Psychology and Education. David McKay , New York , 1966.
- Intermediate values can be derived by linear interpolation.
The following differences exist between this calculation (in R base) and the Elo table:
D     <- c(343, 344, 358, 392)      # import from Elo table
P     <- c(.88, .88, .88, .92)      # import from Elo table
dD    <- 20L                        # increment    in D = 0, 20, 40, etc.
sd    <- 200L * (10L / 7L)          # standard deviation.
dZ    <- 0.07                       # dD / sd, increment in Z.
Z0    <- trunc(D / dD) * dD / sd    # index in Z table begin.
Z1    <- round(Z0 + dZ, 2)          # index in Z table end.
PZ0   <- round(pnorm(Z0), 4)        # P before.
PZ1   <- round(pnorm(Z1), 4)        # P after.

ix    <- D %% dD                    # index 0 - 20.
Pstep <- (PZ1 - PZ0) / dD           # interpolation step.

P4    <- PZ0 + ix * Pstep           # intermediate percentage.
P2    <- round(P4 + 5E-5 + 1E-6, 2) # rounded up to 4 decimals then 2.
Diff  <- round(P2 - P, 15)          # Diff with Elo table.
cbind(D=D, P=P, Diff=Diff, P2=P2, P4=P4, Pstep=Pstep, ix=ix, PZ1=PZ1, PZ0=PZ0, Z1=Z1, Z0=Z0)
Output.
##        D    P  Diff   P2      P4   Pstep ix    PZ1    PZ0   Z1   Z0
## [1,] 343 0.88  0.01 0.89 0.88498 0.00066  3 0.8962 0.8830 1.26 1.19
## [2,] 344 0.88  0.01 0.89 0.88564 0.00066  4 0.8962 0.8830 1.26 1.19
## [3,] 358 0.88  0.01 0.89 0.89488 0.00066 18 0.8962 0.8830 1.26 1.19
## [4,] 392 0.92 -0.01 0.91 0.91480 0.00055 12 0.9192 0.9082 1.40 1.33
Elo probably made a few clerical errors during the laborious manual calculation.
##      D    P   Diff   P2      P4    Pstep  ix    PZ1     PZ0    Z1   Z0
##     343 0.88     0 0.88 0.88416 0.000720*  3 0.8962  0.8820* 1.26 1.19
##     344 0.88     0 0.88 0.88488 0.000720*  4 0.8962  0.8820* 1.26 1.19
##     358 0.90     0 0.90 0.89496 0.000720* 18 0.8962  0.8820* 1.26 1.19
##     392 0.92     0 0.92 0.91498 0.000565  12 0.9195* 0.9082  1.40 1.33

