Here is a quick an dirty analysis based on the "Million Base" PGN database. I did this in a bit of a rush, so there may well be errors in my programming or logic. Please don't use it for anything too serious. Update - Note: Actually, I've just noticed I made a mistake with the data set, and limited it to the first 1 million records. I'll post an update when I get some free time to run it again on the full thing. In the meantime, these numbers should be interesting, nevertheless.
Obtaining the data:
I obtained the Million Base 1.74 file from this URL, since the top-5000.nl site seems to 404 when you actually try to download it. The file contains just over 1 million games in PGN export format (that is to say, easy to parse).
Unfortunately, more than 60% of the games lacked any rating information (I was looking for "WhiteELO" and "BlackELO" tags), and even fewer had ratings for both players. In the end, I decided to get as large a sample size as I could, and counted a player's moves if his or her rating was known, regardless of the other player's rating.
Process:
The games were parsed one by one, and if a player's rating was known, all of their moves for that game would be added to the aggregate for the player's rating group. I chose to divide the ratings into groups of 100, so e.g. 1600 to 1699 was a single group.
Since the actual movetext in PGN is SAN, I used the following shortcut to count the moves: Knight (N), Bishop (B), Rook (R), Queen (Q) and King (K) moves all begin with their piece's letter. Castling (O-O and O-O-O) was counted separately, as a special case. All remaining moves were counted as pawn moves without further examination.
No data cleanup was done. There was no attempt to identify outliers and remove them (e.g. exceedingly short and long games, etc). I kept, but did not include in the following analysis, the results from ratings below 1600 - the sample size for these games was well below 100, leading to large variations in results. The raw data is provided at the end of this post.
Some shortcomings of the information: at the moment, I've only collected very basic totals, and provided averages. I am pretty sure that in general, the data is NOT normally distributed, but won't be able to say more without actually outputting the raw counts and running them through a statistical program. I may do so, if there's interest. For the moment, this means no confidence intervals, or other information about the distribution of the numbers that those averages represent. I also haven't checked how many years the data set spans - if it represents many years, it may be beneficial to attempt to correct for the overall strength of the field.
Some Trends:
A word on player ratings - the most frequent rating groups encountered were, in order: 2400 to 2500, 2500 to 2600, and 2300 to 2400. These rating groups provided 72% of the games counted.
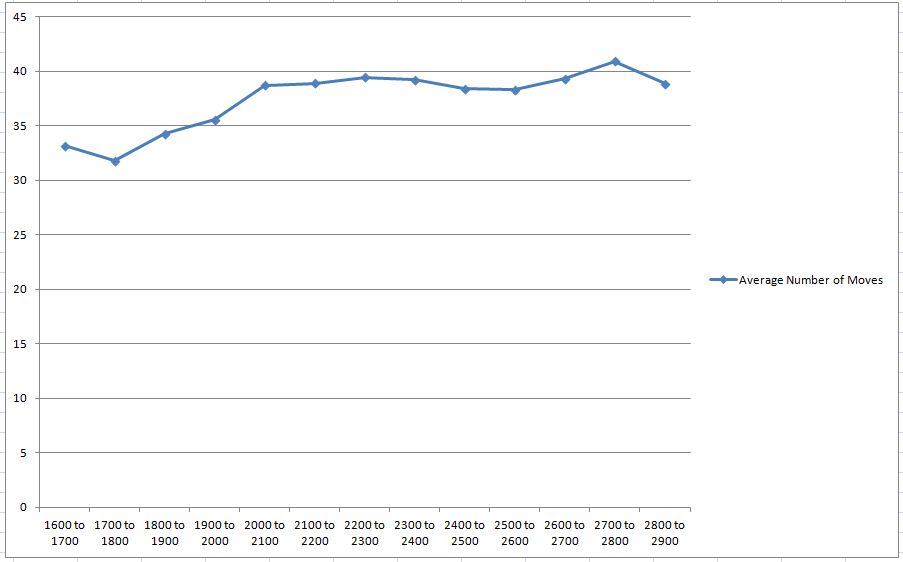
Looking at the actual results, average game length was a bit of a surprise:

The sub-2000 rating groups all had significantly shorter games than the higher groups. This may well be explained by the possibility that they were playing stronger opponents (see the average rating, above), and that they were defeated in fewer moves. This seems to go against the slightly shorter games played by the top rating group, although that may be contributed to a smaller sample size.
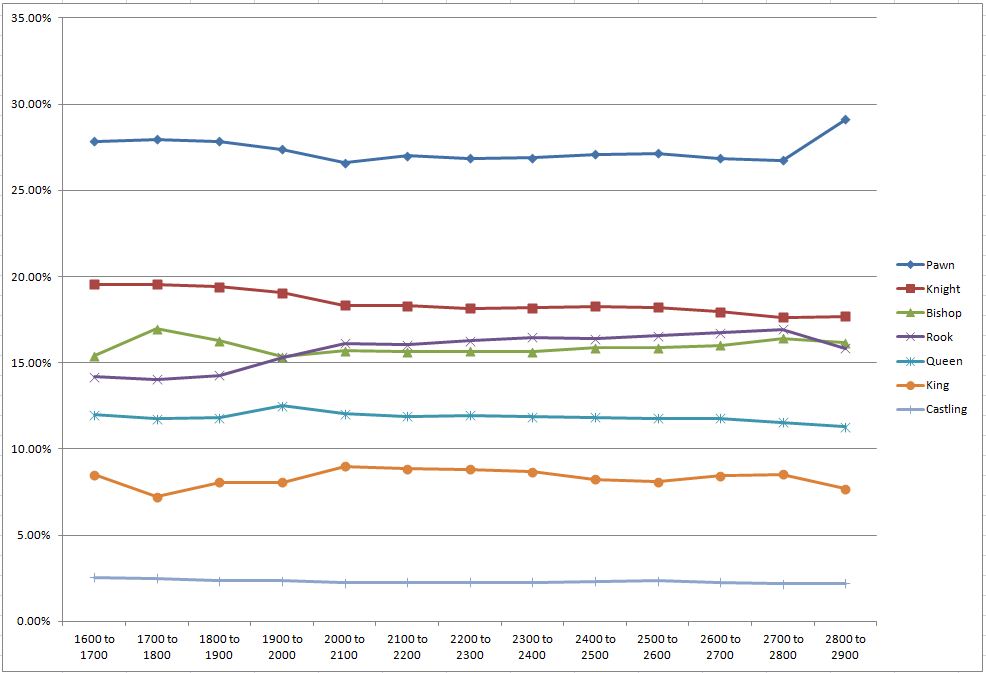
The relatively large differences in average game length meant that providing the frequency of moving a certain piece, rather than the total number of times a piece is moved, is perhaps the more fair comparison. Calculating the frequencies results in the following graph:

The following trends seem to be present:
- The frequency of knight moves seems to trend slightly downwards with rating.
- Bishop moves trend downwards until about 2000, then slowly trend upwards.
- Rook moves trend sharply upward at roughly the same point, and stay more frequent than Bishop moves in high-level play.
- Pawn moves seem to trend slightly downwards with increased rating. A large exception is the top category, 2800 to 2900. This brings us to the next point:
- The top rating category provides outliers or counter-trends in quite a number of measurements. This may be explained in a variety of ways - 1) the sample size is fairly low at 363, not tiny, but 10% of the next smallest sample size included. 2) Since they are at the top of the ratings groups, they never play "stronger" opponents than themselves. 3) Or simply at this level, their play style has transcended the levels below them. My guess would be a combination of 1) and 2).
- The differences in queen moves and castling moves is very small without any real trends, other than a tiny trend downwards in both cases.
- The frequency of king moves has some of the largest differences. No clear trend is visible, and it seems to change direction 3 or 4 times.
Further Analysis
Some ideas for future analysis:
- Basic statistical fixes: I feel that extremely short and long games should probably be excluded. Also, the distribution of the actual counts might be very telling.
- Splitting the analysis further up may also yield interesting results. For example, I would be interested to know how the frequencies for black and white match up (Are they the same, or different? Why?).
- Categorisation by difference in rating might also be interesting, do players playing a much stronger opponent (say, 200 ratings above them) play with different move frequencies? Unfortunately this requires both players' ELO to be known, which is rare in this data set.
- Tendency to short vs. long-castle might also vary by rating.
- Piece promotion statistics, some light structural analysis (e.g. incidence of doubled pawns, en passant, pins, forks, shown by rating) might be insightful.
- "Heat-maps" of piece placement on the actual board, shown by rating might also be quite intersting.
Aggregate data in CSV format
For those who want to play with the data, feel free.
Rating Range,Sample Size,Average Game Length,Average Pawn Moves,Average Knight Moves,Average Bishop Moves,Average Rook Moves,Average Queen Moves,Average King Moves,Average Castling
1100 to 1200,4,28.500,7.000,4.000,4.000,6.500,3.750,2.750,0.500
1300 to 1400,16,34.125,9.250,6.813,5.000,4.438,4.563,3.188,0.875
1400 to 1500,35,33.800,9.400,6.114,5.514,4.514,4.057,3.400,0.800
1500 to 1600,61,33.607,8.705,7.459,4.984,4.443,4.033,3.148,0.836
1600 to 1700,163,33.153,9.227,6.485,5.110,4.699,3.969,2.816,0.847
1700 to 1800,301,31.811,8.894,6.223,5.402,4.468,3.734,2.296,0.794
1800 to 1900,307,34.251,9.537,6.642,5.577,4.889,4.039,2.759,0.808
1900 to 2000,450,35.551,9.731,6.778,5.451,5.444,4.442,2.871,0.833
2000 to 2100,3958,38.731,10.302,7.095,6.072,6.242,4.668,3.481,0.871
2100 to 2200,11217,38.905,10.501,7.116,6.086,6.245,4.629,3.445,0.884
2200 to 2300,50848,39.446,10.595,7.167,6.174,6.420,4.717,3.484,0.889
2300 to 2400,79322,39.248,10.551,7.141,6.141,6.469,4.653,3.402,0.891
2400 to 2500,111867,38.394,10.398,7.013,6.086,6.294,4.542,3.168,0.893
2500 to 2600,92225,38.308,10.396,6.972,6.082,6.344,4.515,3.104,0.896
2600 to 2700,33193,39.340,10.565,7.061,6.295,6.579,4.630,3.318,0.891
2700 to 2800,4805,40.938,10.945,7.221,6.725,6.930,4.726,3.494,0.895
2800 to 2900,363,38.865,11.311,6.879,6.284,6.160,4.391,2.983,0.857


