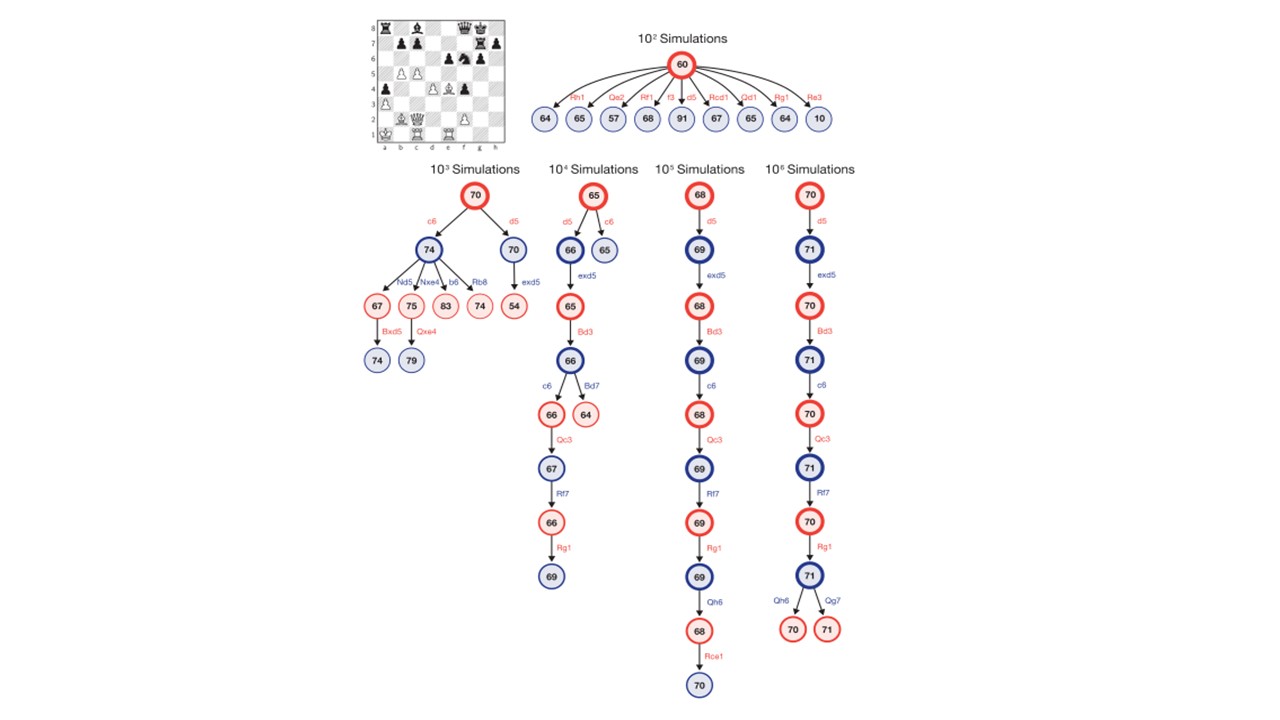
I am aware of related questions and great answers on the same topic such as Understanding AlphaZero. My questions are related to the following figure on AlphaZero's search procedure
This figure comes from the Science paper on AlphaZero (Fig. 4, page 4). The search is illustrated for a position from the very nice game 1 AlphaZero (white) and Stockfish (black) after 29. ... Qf8. The rest of note of the figure is as follows
The internal state of AlphaZero's MCTS is summarized after 10^2, ..., 10^6 simulations. Each summary shows the 10 most visited states. The estimated value is shown in each state, from white's perspective, scaled to the range [0, 100]. The visit count of each state, relative to the root state of that tree, is proportional to the thickness of the border circle. AlphaZero considers 30.c6 but eventually plays 30.d5.
I would appreciate some insights regarding the following questions. (Important to note that I am a mere chess player with no knowledge on computer science. I still find this fascinating)
- What does represent the 10^2, ..., 10^6 simulations? I am very confused because in the Supplementary Material they note that ``During training, each MCTS used 800 simulations''.
- What does it mean that each MCTS used 800 simulations?
- I assume that the value of 60 in the red circle in the 10^2 simulations represents a 60% expected score for white, which is the average of all position evaluations. However, the simple average of the 9 moves shown is equal to 61.2. I guess that other moves also considered and simulated. Am I right here?
- I assume that for simulations 10^3 to 10^6, they only present an illustrative sample of the branches. The simulation 10^5 is not shown after 34.Rce1 or stopped after 34.Rce1? I guess that each simulation goes until an expected score of 100%.

